“Know your numbers.” As a restaurant owner, perhaps you’ve heard this saying before. To run your business successfully, you need to be familiar with not only your own finances, but also other important numbers like restaurant industry statistics. This kind of information gives you key insight into the broader context of the industry and a benchmark to gauge your own success.
Being familiar with current restaurant statistics can help you better understand the shifts in the industry – including changing guest behavior – and enable you to keep up to date on the latest restaurant trends, so you can stay ahead of your competition.
In this article, we’ll present 81 restaurant industry statistics for 2025 from various TouchBistro reports and other trusted sources, including:
- Restaurant sales statistics
- Restaurant menu statistics
- Restaurant labor statistics
- Restaurant marketing statistics
- Restaurant technology statistics
- Restaurant consumer statistics
Let’s dive into the latest restaurant statistics!
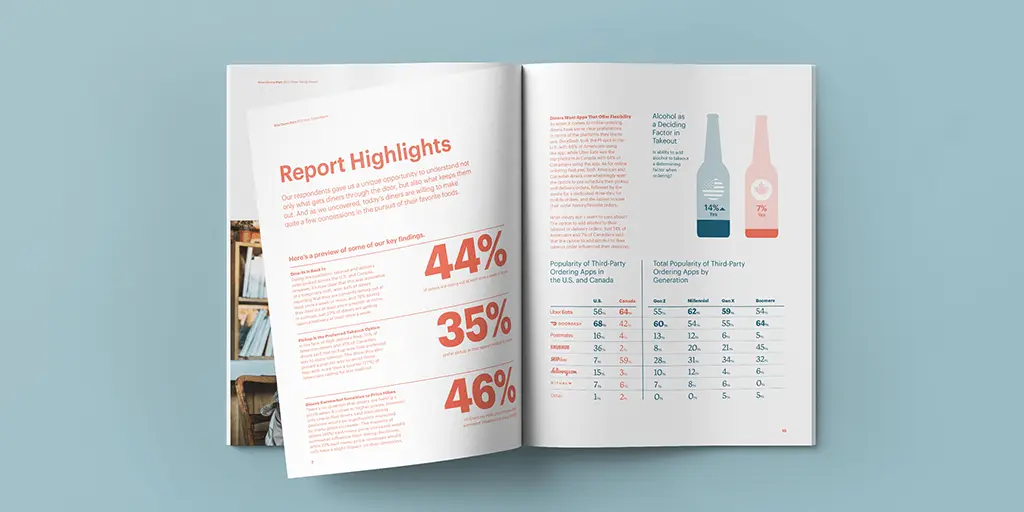
Find out what today’s diners want, including how they choose restaurants, their dining habits, and their biggest deal-breakers.

Restaurant Industry Statistics
To understand where the industry is headed, you need to know a thing or two about its current state. Let’s have a look at a few U.S. restaurant industry trends for 2025 based on current restaurant industry data.
- 150,115: the number of single location full-service restaurants as of 2024 (IBISWorld)
- 9 in 10 restaurants have fewer than 50 employees (National Restaurant Association)
- 7 in 10 restaurants are single-unit operations (National Restaurant Association)
- 140,517: the number of chain restaurants as of 2024 (IBIS World)
- 3.9 restaurants per 10,000 households in San Francisco, California – the highest concentration per capita in the U.S. (Finances Online)
- $2,375: the average amount U.S. households spend on dining and takeout purchases each year (Motley Fool)
- 26% of restaurateurs cited inventory as their biggest source of financial stain in 2024 (2025 State of Restaurants Report)
- $51,040: the average amount of debt full service operators carried in 2024 (2025 State of Restaurants Report)
- 97% of full service restaurants planned to expand their business in some way in 2025 (2025 State of Restaurants Report)
- $1,767.54 billion: the size the U.S. foodservice market is expected to grow to by 2030 (Fortune Business Insights)
- 7,606: the number of ghost kitchen businesses in the U.S. (IBIS World)
Restaurant Sales Statistics
From inflation to changing diner habits, restaurant sales have been on a rollercoaster over the past few years. Let’s dig into some U.S. sales figures and restaurant revenue statistics to get the full picture.
- $1.5 trillion: the total number of restaurant sales expected by the end of 2025 (2025 State of the Restaurant Industry, National Restaurant Association)
- $1,911,7110: the average annual revenue for full service restaurants in 2024 (2025 State of Restaurants Report)
- 9.8%: the average profit margin for full service restaurants (2025 State of Restaurants Report)
- 47% of restaurants increased their menu prices in 2024 (2025 State of Restaurants Report)
- 22%: the proportion of business that restaurants process through online ordering, on average (2025 State of Restaurants Report)
- 16%: the average increase in sales that restaurants see from adding online ordering (2025 State of Restaurants Report)
- Diners spent 5% more on U.S. restaurants than they did in 2023 (2024 Restaurant Trend Report)
- $54 is the average spend for dine-in orders in the U.S. (2025 Diner Trends Report)
- $38 is the average spend for takeout orders in the U.S. (2025 Diner Trends Report)
- Loyalty program members generate 12-18% more on average incremental revenue growth annually than non-members (Deliverect 2024 Loyalty Stats and Trends)
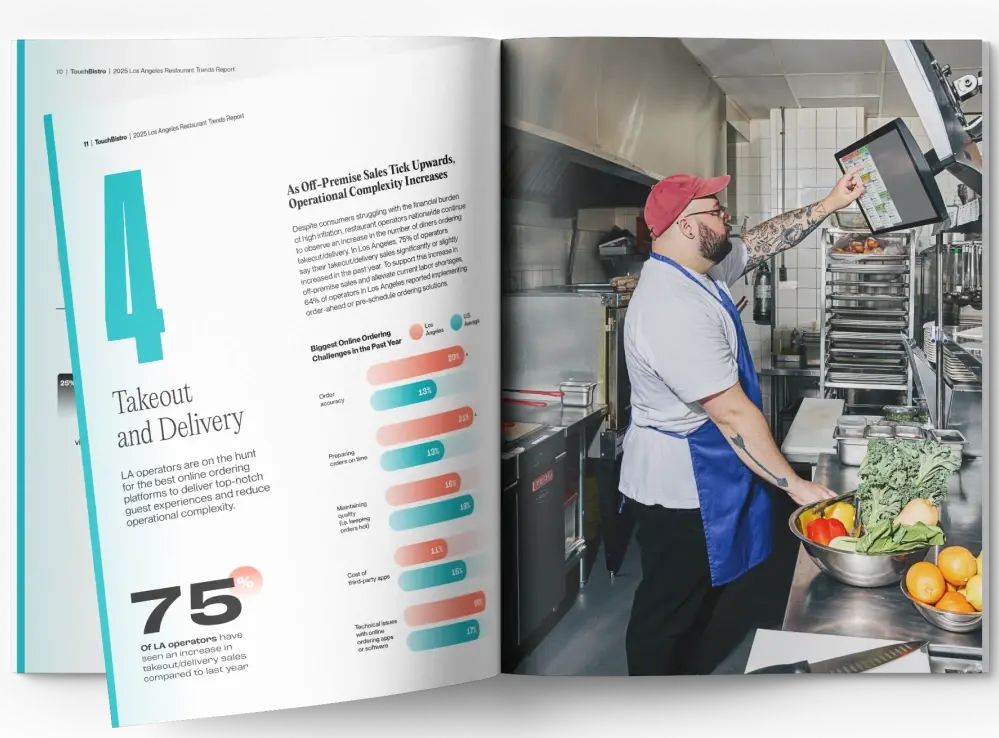
Get the top trends and insights with our 2025 restaurant industry report.
Restaurant Menu Statistics
Now, we’ll look beyond restaurant revenue statistics at the dining trends and restaurant consumer trends that are shaping the industry – specifically when it comes to restaurant menus.
- 44% of diners order takeout and delivery at least once a week (2025 Diner Trends Report)
- Friday and Saturday are the most popular days of the week to order food (2024 Restaurant Online Ordering Trends)
- Monday is the most popular day for morning orders (2025 Diner Trends Report)
- 6 p.m. local time is the most popular time to order food (2024 Restaurant Online Ordering Trends)
- 42% of restaurants plan to add more locally sourced ingredients to their menus in 2025 (2025 State of Restaurants Report)
- 40% of restaurants plan to add more non-alcoholic drinks to their menus in 2025 (2025 State of Restaurants Report)
- 49% of restaurant plan to add catering in 2025 (2025 State of Restaurants Report)
- Customers ordered nearly 1.3 million birria orders this year alone (Grubhub’s 2024 Delivered Trend Report)
- 21% of decaf orders were placed after lunch (Grubhub’s 2024 Delivered Trend Report)
- 1.6 million family meals were ordered from consumers’ favorite restaurants in 2024 (Grubhub’s 2024 Delivered Trend Report)
Restaurant Labor Statistics
No list of restaurant numbers would be complete without information on labor, which is one of the most critical restaurant industry trends to watch give the recent minimum wage increases.
- 79% of restaurants report being short at least one position in 2024 (2025 State of Restaurants Report)
- 29% of full service restaurants are short on bartenders, making it the most in-demand position (2025 State of Restaurants Report)
- 99% of operators say they are spending more on labor costs this year compared to last year (2025 State of Restaurants Report)
- 30% of operators say they have cross-trained/repurposed staff to keep labor costs low (2025 State of Restaurants Report)
- $3,560 is the average cost of training a new restaurant employee (2025 State of Restaurants Report)
- 26% is the average employee turnover rate at full service restaurants (2025 State of Restaurants Report)
- 110 days is the average employee tenure (Restaurant Employee Retention 7shifts Data Study)
- 34% of staff cite wages as their reason for leaving or planning to leave a job (Restaurant Employee Retention: 7shifts Data Study)
- 82% of restaurants spend more than $2,000 on training a new employee (2025 State of Restaurants Report)
- 46% of restaurants have added QR code menus to reduce labor costs (2025 State of Restaurants Report)
- 44% of operators cited staff turnover as their number one labor concern in the past year (2025 State of Restaurants Report)
- 41% report more efficient FOH teams after introducing automation (2025 State of Restaurants Report)
Get 3 actionable strategies for finding, hiring, and keeping great restaurant staff.

Restaurant Marketing Statistics
It’s essential to keep your finger on the pulse of the latest restaurant industry data, so you can stay on top of changing marketing trends. Let’s explore the marketing channels and promotions making news among restaurant industry statistics in 2024.
- 69% of operators have a website for their restaurant (2025 State of Restaurants Report)
- 72% of restaurateurs use Facebook to promote their business, making it the #1 social media site for restaurant marketing in the U.S. (2025 State of Restaurants Report)
- 63% of full service restaurants currently offer a loyalty program (2025 State of Restaurants Report)
- 51% of customers find deals via a restaurant’s app, while 43% find deals via coupons in the mail (Bluedot’s The State of What Feeds Us, Vol VII)
- 44% of Gen Z diners are finding restaurant deals and coupons on social media (Bluedot’s The State of What Feeds Us, Vol VII)
- 67% of Gen Z and Millennials use social media to decide on a restaurant (2025 Diner Trends Report)
- 45% of diners look for a restaurant’s business profile on Facebook (2025 Diner Trends Report)
- 39% of all diners want to receive personalized loyalty offers (2025 Diner Trends Report)
- 46% are influenced to visit coffee shops when offered afternoon deals and offers (Bluedot’s The State of What Feeds Us, Vol VII)
- 41% of diners have checked a restaurant’s Google reviews in the last three months (2025 Diner Trends Report)
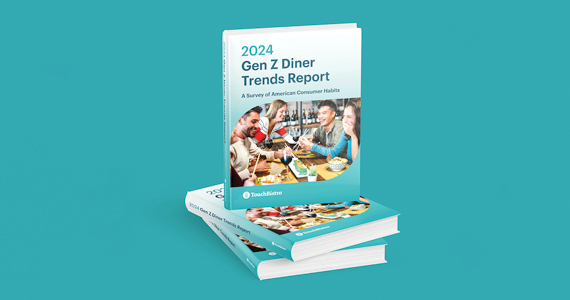
Explore the latest dining trends for Gen Z consumers based on their eating habits, behaviors, and preferences.
Restaurant Technology Statistics
The right technology is key to running a thriving restaurant. It’s time to dive into everything from POS statistics to QR code usage and more, so you can learn how your venue stacks up.
- 95% of operators use some form of AI in their restaurant (2025 State of Restaurants Report)
- 50% of restaurateurs have automated inventory management in their restaurant (2025 State of Restaurants Report)
- 53% of restaurateurs have automated email marketing at their restaurant (2025 State of Restaurants Report)
- 47% of restaurateurs have automated staff scheduling at their restaurant (2025 State of Restaurants Report)
- 28% of restaurateurs say the biggest barrier to automation is the high upfront cost (2025 State of Restaurants Report)
- 63% of restaurants use a cloud-based POS system, while 34% report using a legacy POS system (2024 State of Restaurants Report)
- 86% of full service operators use the same POS system at all their locations (2025 State of Restaurants Report)
- 30% of restaurateurs say ease of use is the most important factor when choosing a POS (2025 State of Restaurants Report)
- 34% of restaurateurs say multi-location management capabilities is the most important factor when choosing a POS (2025 State of Restaurants Report)
- 99% of restaurants use at least one online ordering platform, and on average, most use three platforms (2025 State of Restaurants Report)
- 48% of diners say they are comfortable with AI-generated offers/discounts (2025 Diner Trends Report)
- 59% of diners say they are comfortable with technology in restaurants (2025 Diner Trends Report)

Restaurant Consumer Statistics
Your customers are the most important ingredient in the recipe for a successful restaurant business. Let’s examine diner habits, preferences, and behaviors, so you can serve up more love to your guests!
- 42% of diners are dining out at least once a week or more (2025 Diner Trends Report)
- 61% of diners say there has been no change in their tipping habits this year when dining out (2025 Diner Trends Report)
- 91% of diners have noticed price increases at restaurants (Bluedot’s The State of What Feeds Us, Vol VII)
- 77% of consumers have noticed that they’re paying the same amount of money for smaller portion sizes (Bluedot’s The State of What Feeds Us, Vol VII)
- 73% of customers are ordering off value menus more often due to costs (Bluedot’s The State of What Feeds Us, Vol VII)
- The number one reason diners are tipping more is because they are generally satisfied with the service/experience (2025 Diner Trends Report)
- 27% of diners say they seek out fast food restaurants the most often (2025 Diner Trends Report)
- 58% of diners rank quality of food as the #1 most important factor when dining in (2025 Diner Trends Report)
- 50% of diners decide where to eat based on location (2025 Diner Trends Report)
- 40% of diners prefer walk in and pick-up as their takeout method of choice (2025 Diner Trends Report)
- 48% of diners say they are currently part of a restaurant loyalty program (2025 Diner Trends Report)
- 62% of diners say they would be motivated to visit a restaurant offering a limited time offer (LTO) (2025 Diner Trends Report)
- 21% of diners usually place a to-go order through the drive-thru (2025 Diner Trends Report)
- 73% of Americans use the online ordering app DoorDash (2025 Diner Trends Report)
- 33% of diners say they rarely make a reservation when visiting a restaurant (2025 Diner Trends Report)
- 42% of diners say a table wait time over 30 minutes would deter them from visiting a restaurant (2025 Diner Trends Report)

Find out what today’s diners want, including how they choose restaurants, their dining habits, and their biggest deal-breakers.
Industry knowledge is key to restaurant success. You now have a comprehensive list of 81 restaurant statistics in your back pocket. With knowledge of these restaurant numbers and the latest restaurant consumer trends, you’ll be well-positioned to tackle whatever market conditions impact the sector in 2025.
Free job application template for restaurants
Sign up for our free weekly TouchBistro Newsletter


