Your Cost of Goods Sold (CoGS) lets you know how well you are pricing your products and controlling your inventory. As a restaurant owner, it’s important that you know how these ratios are calculated and what they can tell you about the general health of your business.
To make restaurant inventory management a breeze, here’s a quick guide to calculating CoGS and what’s considered standard for your type of venue.
Understanding CoGS
“Cost of Goods Sold” is the raw material costs of your menu items – the actual amount of food and beverage used to produce your food and beverage sales.
It’s important to note that CoGS is separate from theoretical costs. “Theoretical Cost” is what you should have used: your ideal spend. But the cost of the food and beverage you actually used is not always equal to what you should have used based on your recipes.
Raw material costs can change, and then there’s waste, inconsistent portioning, and shrinkage (the polite term for employee theft) – these can all create differences in theoretical versus actual costs. Your accountant will produce your actual cost using your inventory and invoices as inputs.
So, back to CoGS. The formula for CoGS is:
[Beginning Inventory of F&B] + [Purchases] – [Ending Inventory] = CoGS for the period
Or:
The amount of food and beverage you start with: [Beginning Inventory]
+
The amount of food and beverage you bought: [Purchases]
–
The amount of food and beverage left: [Ending Inventory]
=
The amount of food and beverage used: [CoGS]
Beginning Inventory is the amount of food and beverage you have in stock on the first date for the date range you’re reporting on.
Purchases during that same period are all food and beverage invoices added to your inventory.
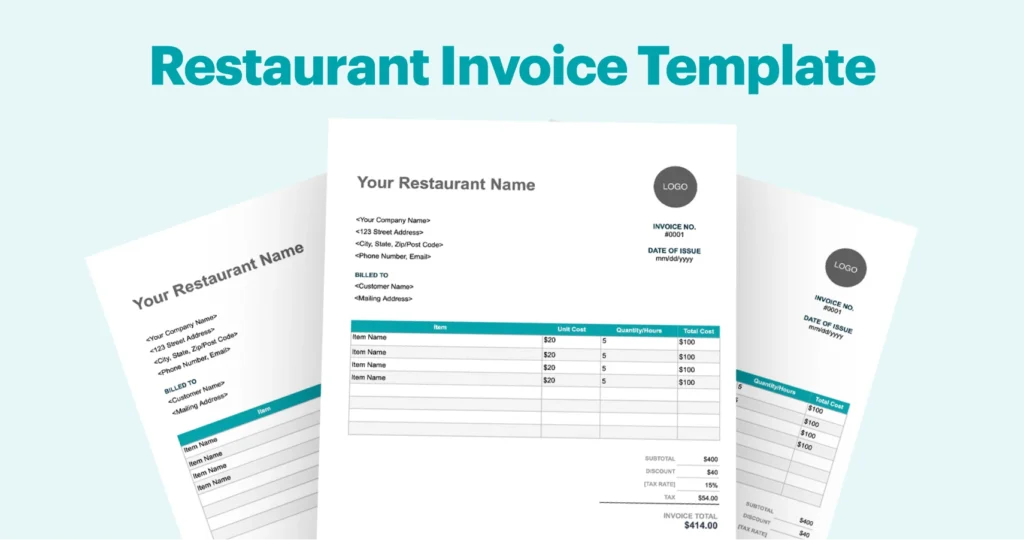
Use this restaurant invoice template to create invoices with ease, saving you time and helping you get paid faster.
Ending Inventory is the food and beverage items you still have at the end of the same period.
Best practices in managing restaurant costs recommend consistently comparing what should have happened (theoretical CoGS) with what actually happened (actual CoGS) – and then work on narrowing the gap.
Find Your Ideal Ratio
Normally, CoGS is expressed as a ratio of a percentage of cost-to-sales. These ratios are usually categorized as follows:
| Revenue / Cost | Standard ratio range (%) |
| Food cost / Food sales | 25–40% |
| Beverage (non-alcoholic) cost / Beverage (non-alcoholic) sales* | 10–30% |
| Wine cost / Wine sales | 30–50% |
| Draft beer cost / Draft beer sales | 20–40% |
| Bottled (canned) beer cost / Bottled (canned) beer sales** | 30–35% |
| Liquor cost / Liquor sales | 10–20% |
| Bar mix and consumables cost / Liquor sales*** | 5–25% |
Acceptable ratios are largely determined by your regional market and business model, and can vary from concept to concept. As a general rule, your combined CoGS and labor costs should not exceed 65% of your gross revenue – this would be a major inventory mistake. However, if your business is in an expensive market, you should aim for an even lower percentage.
Generally accepted ratios vary from market to market and concept to concept. Your percentage of costs will be largely determined by how much you sell something for versus how much it costs to produce. The cost percentage will be generally determined by the bestsellers on your menu, rather than the menu as a whole.
A steakhouse or high-end seafood restaurant can have food costs of 40% and higher. A “from scratch” Italian restaurant specializing in pasta and pizza in a high-rent neighborhood could have a food cost as low as 20%. The key difference is the average check and the amount of labor needed to serve those items.
Rolling dough, cutting noodles, and prepping sauces and toppings are a lot more labour intensive than a restaurant that does not transform the raw product as much. Grilled steaks and steamed seafood, for example, don’t require much beyond proper seasoning, cooking, and storage/handling. A restaurant can be profitable with a 40% food cost, as much as a restaurant with 20% food cost can be losing money.
Can’t See the Dollars for the Percentages
It’s important when evaluating your CoGS performance and using ratio analysis that you keep in mind the gross profit of every item, rather than trying to “manage by the percentages”.
For example, if you think it’s better to sell a $30 bottle of wine that costs you $10 (33% CoGS) rather than a $100 bottle of wine that costs you $50 (50% CoGS), you need to ask yourself if you’d rather have a $20 or $50 in the bank. Menu pricing is an art, combining financial savvy with expert knowledge of the market and a crystal clear vision of your restaurant concept.
The more unique and niche your product, the higher the margin you can command (and the lower your CoGS percentage ratio). The more well-known the product (for example, a commonly available bottled beer), the closer you will have to match the margin charged by your competition. If you’re charging more for the same beer as the bar next door, it’s important to communicate how your restaurant delivers more value to your customers beyond the beer.
FAQs
How to calculate restaurant cost of goods sold accurately?
The most accurate way to calculate your cost of goods sold (COGS) is to follow this 4 step process:
- At the start of your inventory period, count every ingredient, beverage, and raw material on hand. Multiply each quantity by its most recent purchase price and add them up to get your starting dollar value.
- Track total purchases during your inventory period by summing up all invoices for food, alcohol, and raw ingredients received during the same timeframe. Do not include non-food operational supplies (i.e. cleaning supplies, takeout containers, etc.)
- At the end of your inventory period, conduct a physical count of all food and beverage stock on hand at the close of the last day. Value these items using current unit costs.
- Finally, calculate your COGS, by using the following formula: COGS = Beginning Inventory + Purchases – Ending Inventory
How to calculate cost of goods sold from trial balance?
Calculating COGS directly from a trial balance (an internal bookkeeping worksheet that lists all your business accounts and their balances) depends on whether your accounting system uses a Periodic or Perpetual inventory system.
- Periodic: In a periodic system, the inventory account on your trial balance is not updated automatically as sales happen. Instead, it reflects your Beginning Inventory from the start of the accounting period. To calculate COGS, combine specific accounts from your trial balance: COGS = Beginning Inventory + Purchases + Freight-In – Purchase Discounts/Returns – Ending Inventory
- Perpetual: In a perpetual inventory system (standard in modern POS and ERP software), inventory and COGS update automatically with every sale. All you need to do is Find the Cost of Goods Sold account under the Expense section on your Trial Balance (Debit balance).
How to reduce errors when calculating cost of goods sold?
Most COGS errors are caused by inconsistent timing, messy unit conversions, and poor invoice tracking. To reduce errors, employ the following tips:
- Standardize the inventory process by counting at the exact same time every period.
- Ensure purchase invoices are logged in the period the inventory was received, not when the bill was paid.
- Keep non-food/non-beverage expenses out of your COGS accounts (i.e. napkins, cleaning supplies, takeoutboxes, etc.).
- Implement variance checks and waste logs, so you can separate true food sales from operational waste.
How to compare theoretical and actual COGS in restaurants?
Comparing Theoretical COGS (what your cost should be based on sales) against Actual COGS (what your cost actually was based on stock counts) is known as COGS Variance, and it reveals your restaurant’s total waste, theft, and portioning errors. You can calculate COGS Variance using the following formula: Variance = Actual COGS – Theoretical COGS
How to forecast cost of goods sold for budgeting?
To calculate COGS for a budget requires predicting your expected sales volume and the cost of raw materials required to meet that demand. There are 3 main approaches for forecasting your COGS:
- Percentage of Sales (Top-Down): For businesses with stable margins, the simplest method is to apply a target or historical COGS percentage directly to your projected sales revenues.
- Unit-Level / Recipe Costing (Bottom-Up): Another method is to build your forecast based on projected unit sales multiplied by individual product cost cards.
- Driver-Based Adjustment (Historical Trend + Inflation): You can also take your historical COGS as a baseline and explicitly adjust for key cost drivers, like supplier price inflation, volume changes, and waste targets.
How to lower cost of goods sold without hurting quality?
The best way to lower COGS without impacting the quality is to focus on reducing waste, improving efficiency, and optimizing your purchasing strategy. Some of the best ways to do this include:
- Optimize Yield & Reduce Prep Waste: Maximize the usable portion of what you already buy by tracking usable yields, repurposing trimmings, and cross-utilizing ingredients.
- Tighten Portion Control: Use precision tools and standardized recipe cards to keep portion sizes consistent.
- Audit Suppliers and Renegotiate: Consider consolidating your purchasing power with fewer suppliers to qualify for volume rebates or primary distributor tier discounts. You can also Join a Group Purchasing Organization to leverage collective bargaining power.
- Eliminate Waste & Spoilage: Ensure goods are not expiring while still on the shelf by strictly employing first-in, first-out inventory, adjusting order pars dynamically, and running daily waste logs.
Cost of Goods Sold is one of the essential measures of the general health of your restaurant. Calculating the percentage Cost of each category of Goods consistently will help you make useful decisions about how well you are managing your restaurant as a profitable business.
*Food and non-alcoholic beverage are sometimes combined, but this is less common.
**Draft and bottled beer is sometimes combined, but this is not recommended. The serving, storing, and pouring methodology for each is different, as are the costs.
***Bar consumables are sometimes combined with non-alcoholic beverage or liquor; use your own discretion to determine with your accountant if this is right for your restaurant.

Melanie is a veteran of restaurant strategy, finance and operations, starting her career in her mother’s bakery franchise as a part-time dishwasher and pie-presser. As past Product Manager at TouchBistro, she brought subject matter expertise gleaned from decades of experience as a General Manager, Director of Food and Beverage, Corporate Controller and Strategic Consultant for some of Toronto’s top venues, including Service Inspired Restaurants, Mercatto Restaurant Group and The Drake Hotel Properties.
Learn how to make the most of your restaurant reports
Get our restaurateur newsletter: The Bistro Insider

What will reservation software cost you?
Find Out