We spent the early months of 2020 compiling and analyzing research for this second annual State of Full Service Restaurants report for the U.S., excited to share our findings on the industry. Unfortunately, just as we were about to publish, COVID-19 was declared a pandemic and the state of restaurants came into question – virtually overnight.
Restaurants have seen the impact immediately. Some have moved to half-capacity to aid with social distancing, others are staying open only for takeout and delivery, while others still have opted to close their doors completely for the time being.
We hit pause on publishing the report and instead turned our attention to creating resources that could help restaurant owners and managers like yourself through this difficult time. We still think the data shared in this report is valuable, just perhaps in a different way than expected.
Our hope is that The State of Full Service Restaurants provides important benchmarks for the start of 2020, indicators we can revisit later in the year and use to set goals for returning things back to normal.
Here at TouchBistro, we plan to release an additional report in the second half of the year to follow up on the current state of restaurants, giving you a complete picture of the industry in 2020: where it started and where it’s headed.
In the meantime, we’re releasing the full report as it stands now.
***
Last year, our annual report gave us a benchmark of what’s happening in the restaurant industry for full service restaurants. This year, we surveyed even more restaurant owners, managers, and CEOs. The results showed us areas where things have largely stayed the same, where there are significant changes, and where there are new opportunities unfolding.
This report will give restaurateurs like yourself a new benchmark for 2020, helping you get a better understanding of what’s happening in the restaurant industry and how that could affect your restaurant.
When you download the full report, you’ll get some powerful insights on:
- Financial Health
- POS & Payments
- Data & Reporting
- Inventory
- Staffing
- Reservations
- Online Ordering
Want to go beyond national results?
This year, we also took a deep dive into five major cities across the U.S., producing additional reports for restaurants in these areas. These reports will give you a better sense of what’s happening close to home – and how these trends compare to the rest of the country. You can download any of our reports below:
Learn the top challenges restaurant owners face – and how to capitalize the new opportunities.
Here’s a sneak peek at what’s happening at FSRs in the U.S. – and what you can learn from them.
Financial Health
If you’re constantly in the red, you’re probably not going to be open long. That’s why financial health – from revenue to rent – is so important to keep a constant watch over.
The best indicator of financial health? Your profit margin.
Last year, the average profit margin for full service restaurants sat at around 11% – and it remains around the same in 2020.
We also saw the same connection between profit margin and number of seats. A larger restaurant means a larger profit margin – but not by a huge amount. The revenue of a restaurant may continue to climb, but the profit margin stays pretty consistent. Use the slider below to see how the size of your restaurant ties to profit margins!
One huge expense restaurant owners face at opening and every month after is rent – an expense that is only going up. See how much it’s gone up over the last year when you download our full report.
POS & Payments
A lot of thought goes into picking everything for your restaurant – from wallpaper to menu items. It’s no wonder restaurant owners are putting a great deal of buying consideration into their POS and payment processing systems.
Factors like price and ease of use remained top of mind for restaurant owners evaluating new technology. But what was the most important factor when people were shopping for a POS? Try to order the top factors below!
But there are a ton of other factors on the list, which are outlined in detail through our national report. One big factor that made the top 10 was the availability of integrated payments. Nearly two thirds of FSRs are using a payment system that integrates with their POS – which makes sense, since it saves time and eliminates errors from manual entry. Typically, the bigger the venue, the more likely they are to look for an integrated system.
Data & Reporting
If you can’t measure it, how can you improve?
This is why so many restaurant owners are turning to data to help optimize their operations and make more informed business decisions. Valuable insights on menu pricing, scheduling, and and hiring needs are only a few taps away through most POS systems. And restaurant owners are making the most of this insight, with 70% saying they understand their reports completely.
The biggest area that data and reporting helps with? Menu pricing! Two in three restaurant owners use their POS reports to inform these decisions. Scroll through below to see exactly what decisions restaurant owners are using reporting for!
However, there are some reports that were checked less frequently than last year – which could be a huge opportunity for your business! Learn what these are and how you can benefit from checking them more often in our full report!
Inventory
Nobody loves inventory management – controlling food costs, minimizing waste, conducting counts, and negotiating with vendors is a full-time in and of itself. But, with two in five restaurants struggling with inventory management, it’s an important area to dive into.
So, how often are restaurateurs checking inventory?
In 2019, 85% of survey respondents checked inventory at least once a week. This went down 15% in 2020. One possible explanation is the rise in new technology now available to help restaurant owners with inventory. When taking advantage of technology to help, the dependency on manual checks goes down. You can see what areas of inventory people are diving into with technology by clicking below.
But how are restaurants managing to rely less on manual inventory checks? Download the report to find out!
Staffing
Your staff make your restaurant come to life. That’s why the restaurant labor shortage is a top concern across the country. Three in four FSRs are struggling with the shortage, which is a 5% increase compared to last year. But not all roles are equal; restaurants are struggling to fill some positions more than others. Which roles are the hardest to fill right now? Find out below!
While it’s hard to find good help, it’s also getting harder to keep them. The average staff turnover rate is only increasing – three in five restaurants experience a turnover rate higher than 20%, an increase from two in five last year.
With turnover high and the labor shortage still an issue, it’s important to ensure your staff feel important – keep the talent you have and make new talent feel valued!
Reservations
Reservations are a critical part of the full service restaurant industry, with 75% of restaurants accepting reservations at their venues. And, since four in 10 tables served at FSRs come from reservations (versus walk-ins), you’ll need to book early to get that seat!
But it’s about more than just how many restaurants are accepting reservations and holding tables for those reservations. It’s about how those reservations are being made. HINT: It’s not just about phone calls anymore!
Reservation technology has made it possible for diners to book at their favorite restaurant in a number of different ways. Restaurants now have to offer a range of booking options, so diners don’t get frustrated and reserve a table with the competition.
So, what are the most popular ways of making restaurant reservations in 2020?
Learn the top challenges restaurant owners face – and how to capitalize the new opportunities.
Online Ordering
Online ordering is only growing in popularity. Don’t think you need it? You’re missing out on a huge revenue stream – over half of FSRs who implement online ordering see an 11% to 20% increase in revenue.
What causes the increase in revenue with online orders? Being able to add on – see how quickly your bill adds up above as you customize your order! Customers are both ordering more items and placing add-ons to their carts – no shame in ordering a double order of fries or those premium toppings when you don’t have to do it face to face.
Want more than just an appetizer? Download the main course! Our full national report reveals more in-depth findings of the restaurant industry and examines the challenges facing restaurateurs in 2020. Download the report now and prepare yourself for a successful year.
Learn the top challenges restaurant owners face – and how to capitalize the new opportunities.
This study was conducted by Maru/Blue research firm on behalf of TouchBistro.
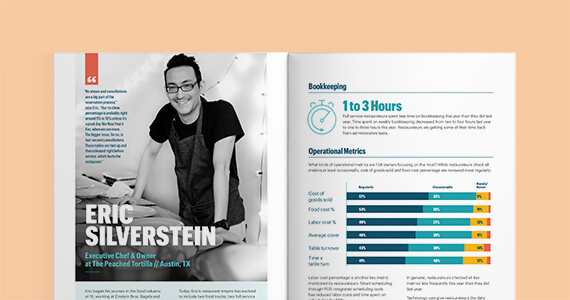
The results come from surveying over 600 full service restaurant owners, managers, and presidents/CEOs from all 50 U.S. states. Included in this number was an increased focused on five major cities: New York City, Chicago, Los Angeles, Miami, and Austin. The research was conducted in November 2019.

Dana is the former Content Marketing Manager at TouchBistro, sharing tips for and stories of restaurateurs turning their passion into success. She loves homemade hot sauce, deep fried pickles and finding excuses to consume real maple syrup.
Download our free inventory template
Get our restaurateur newsletter: The Bistro Insider

Your Complete Guide to Restaurant Reservations
Download Guide