Imagine it’s a beautiful Saturday morning. You – miraculously – have the day off, so you kick back, take a sip of freshly brewed coffee, and crack open a light read: your restaurant business reports.
Okay, maybe these reports aren’t your idea of a fluffy weekend read, but you need to regularly be reading them. Each POS report is a goldmine of business information you may not find otherwise.
Like what? Glad you asked.
In this article, we’ll go over the top reports you need to be regularly checking for your business, how simple (or complicated) they are, and what each report reveals about your business.
Your business report crash course is now in session!
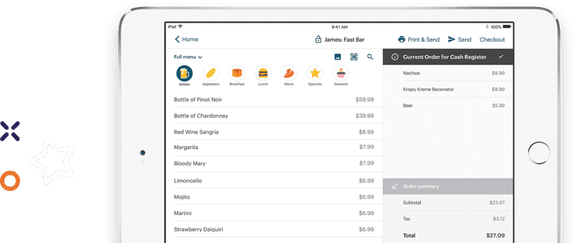
Pro tip: If you’re a TouchBistro customer, log into your Cloud now to look at these reports as we go over them!
Why Your Restaurant Business Reports are Important
Did you know one of the most common reasons that restaurants fail is because of mismanaged costs?
Your sales reports aren’t just numbers – they’re the pulse of your restaurant! They’re the first way to spot red flags, which would save you thousands of dollars, prevent disasters, and let you know what issues need to be addressed ASAP.
And the insights pulled from reports have given restaurant owners actionable insights that let you keep more money in your pocket! One restaurant decreased their COGs rate by over 5%, while another business reduced waste by over 10%, all thanks to issues spotted through their reports.
Let’s go over the different reports and what insights they pull, so you can use them to start saving money now.

Low Complexity Reports: Snapshot Report, Discounts & Voids Report, and Sales Report by Order Type
Consider this your reporting warm-up. These are must-have reports for your restaurants, but are fairly simple to understand. It’s a great place to start getting more comfortable with your business reports and building your confidence to tackle more complex reports.
Snapshot Report
Remember disposable cameras back in the day? You’d snap a picture, wait weeks to get it developed, then get to study the photo and relive the moment.
The snapshot report works the same way, minus the blurs and light leaks. And the waiting. These restaurant performance reports capture a moment in time at your restaurant and serve it up to you for analysis. You get a “live report” of what is going on. Plus, it constantly refreshes and it can be run at any time. Snapshot reports will show you:
- Your revenue at the moment and cost-related items
- Two key amounts for your business: the current cost of labor and the cost of sales (or COGS)
You get an instant temperature check of what is going on in your restaurant. This business report is great because you can spot problems early – before they become a big issue. For example, if you see you’re spending more on labor than what is being sold, you can make the choice to cut a server instead of cutting into daily profit. Or if your COGS ratio and labor combined are taking up too much of your gross revenue (you don’t want them to exceed 65% of gross revenue), you can pivot early to lower that percentage.
And the best part? It’s easy to use.
Discounts & Voids Report
As the title suggests, this report breaks down your discounts and voids. This report is valuable because it only shows your discounts and voids, making it easy to analyze them on their own. This report lays out:
- How much you’re doing in discounts
- How much you’re doing in voids
- The percentage of sales categorized as discounts and voids
- Targets to aim for with discount and void numbers
This report can be extremely helpful, especially when your percentage of discounts and voids seems too high in relation to sales. These reports help you pinpoint this type of issue early, so you can investigate. For example, if you notice your discounts are too high compared to sales, go into this report and break down exactly what’s going on. Is a server or barista making too many mistakes and having to offer discounts to make it up to customers? Or, worst-case scenario, are they using discounts and voids to steal from your restaurant?
Existing TouchBistro Customer? Log in to this report here.
Sales by Order Type
This is a simple report that answers a very important question: When people dine with you, how are they doing it? Are they sitting at the bar or heading home with takeout? You can see this report broken down into a few categories: takeout, delivery, bar tab, or dine-in.
While this is a less complicated report, the info from it can give you valuable business insights. If you notice a surge in take-out, you can investigate why people are choosing not to sit in the dining room. If the bar is getting more popular, you could consider adding some bar specials to encourage these diners to keep coming back!
When you know how people are choosing to dine with you, you can optimize these experiences for them.
Existing TouchBistro Customer? Log in to this report here.

Medium Complexity Reports
Now that you’re all warmed up, it’s time to look into some more complicated reports for restaurants: heatmaps, sales by menu item, labor cost analysis, payment details report, and weekly target reports. With the basics mastered in our first round, you’ll be ready to take on these restaurant performance reports!
Heatmap Reporting
Every restaurant owner has had that moment where you have a full team in venue and no diners, leaving servers rolling cutlery, baristas cleaning, and you spending money on staff you may not have needed.
Heatmap reports help you avoid this unprofitable situation, givingyou a breakdown of how much money is coming in each hour. Use this report to get a better understanding of when your busy hours are, so you can staff accordingly.
You can filter this heatmap in numerous ways, including:
- Total sales – What were the total sales in that hour?
- Quantity – How many bills were closed per hour?
- Average – What was the average bill size in that hour?
Businesses big and small are finding huge value from this report. Uncle Tetsu, a multi-location quick service restaurant, uses this report to help streamline production and reduce their waste. They actually reduced waste by 11% when they started using the information from their heatmap.
Sales management reporting for restaurants is a crucial source of insights for making menu-related decisions, so it’s an important type of report for you to be comfortable reading.
Existing TouchBistro Customer? Log in to this report here.
Sales by Menu Item
The sales by menu item report is exactly what it sounds like – you get a breakdown of sales per menu item over your set reporting range.
When you organize this by menu item, you get sales figures for items individually that you can then filter. Some categories you can sort by include:
- Sales category – This includes your basic categories like food and alcohol, or more unique categories like merchandise! Who doesn’t love a branded sweater?
- Menu category – How are appetizers doing versus your desserts? Are drinks doing better at a certain time?
- Sales percentage – Does one item contribute more to your total sales? If you know your roasted cauliflower is regularly contributing 10% of daily sales, you’ll want to make sure you always have cauliflower in stock
Sales management reporting for restaurants is a crucial source of insights for making menu-related decisions, so it’s an important type of report for you to be comfortable reading.
Existing TouchBistro Customer? Log in to this report here.
Labor Cost Analysis
You know labor is expensive, so understanding just how much you’re spending is important to your business and bottom line. Your labor cost analysis will help break your labor costs down even further, making sure you get the most bang for your buck.
Your labor report can give you a breakdown of labor over a large period of time, versus the Snapshot report giving you a glimpse into the moment. For example, you could look at your spend on the weekend versus a full week, or over a month.
You can also see a breakdown of what you’re selling each hour, to tell you if you’re making enough to compensate for labor costs. If you see you’ve spent $300 in labor over a lunch shift, but only sold $150 in food, you know you may have a problem.
Labor management reporting for restaurants can get pretty detailed, which is why it’s not considered low complexity. You can break down labor as far as:
- How many labor hours you have for each positon
- The cost of labor for each position
- The cost as a percentage of your profit
- The average wage rate across all roles
- The average wage rate per role
It can get pretty detailed. But when it’s covering something as key to your business as labor costs, you want every detail.
Existing TouchBistro Customer? Log in to this report here.
Payment Details Report
Besides sharing your delicious recipes with the world and giving diners a great experience, you went into business to, well, stay in business. And you do this by processing payments. This is why your payment details report is so crucial.
Your payment details report breaks down every payment processed at your business, showing you:
- Every payment that was applied at your restaurant
- The date and time of each bill
- Who on your staff processed each payment
- The value of every payment that went through at your restaurant
- Whether each bill was a full payment or a partial payment
Imagine a customer comes in and says that they were double charged. Pull up your payment details report and you’re able to put that mystery to rest with a few taps!
Existing TouchBistro Customer? Log in to this report here.
Weekly Target Reports
Everybody loves to hit goals, big or small. Weekly target reports help you set targets across your business – from sales to staff – and track your performance throughout the week.
The weekly target report is especially valuable when evaluating staff performance and helping set goals for individual servers. You can do this by looking at each server’s sales, average table turn time, the amount of upselling, their tips, and the number of discounts and voids they are putting through.
When you have concrete numbers to back staff performances, you can work with them to set weekly targets. If you know one server struggles with upselling, you can encourage them to try to increase it. Or if another server is constantly putting through voids, you can consider giving them some extra training to help them avoid making mistakes.

High Complexity Reports
By now, you could be teaching business reports. You’ve reached the highest level of complexity. Are you ready to dive into menu analysis and drill down reports?
Menu Analysis
Menu analysis helps you gauge the performance of an item on your menu in relation to other items in the same menu category.
If you prefer a visual, you can view this report as a table or bar graph to see what menu categories are contributing the most to your bottom line and make business decisions based on it. If you see that your appetizers aren’t contributing much, you could try out a new happy hour and see if that drives traffic!
You can also sort results by different filters, including gross sales, quantity sold, or percent of menu category – just to name a few. You can even use this report to help guide inventory decisions by pulling weekly sales numbers of each number. Goodbye food waste!
This report tends to be on the more complex side, with so much information and so many ways to filter. But it’s also a gold mine of menu information.
Existing TouchBistro Customer? Log in to this report here.
Drill Down Report
What do you get when you cross a detailed breakdown of hourly sales for every menu item with a clean and concise view?
The drill down report!
With the number of filters available and information included, it’s no wonder this report is on the higher complexity side. But the information gathered from it can help you make business decisions that impact each hour of service, so getting comfortable with this report is important.
The drill down report gives you an hour-by-hour breakdown of sales. You can go as general as just a breakdown of food and liquor in hourly sales or as detailed as every food item you have in each category. For example, you can check liquor sales in general, or dive as deep down into a breakdown of each brand of beer and how well they’re doing. From here, you can view net sales or quantity sold.
When viewing this report, you can toggle on and off different filters to help understand each hour. Some of these filters include:
- Menu sections
- Sales category
- Menu category
- Menu items
The great thing about the drill down report – besides all the info you’re getting – is the fact you can change the time view as well! Getting this information hourly is valuable for day-of decisions, but you can also view this report over a week. Compare how certain specials or items perform on weekdays versus weekends, and optimize when you offer specials! Or inform your inventory decisions even further – if you see a certain brand of wine is bringing in little to no money, it may be time to take that off the regular vendor order.
Existing TouchBistro Customer? Log in to this report here.
Now that you’ve graduated from your reporting crash course, you don’t have to fear diving into your restaurant business reports! They can now become a critical tool for running your restaurant successfully. And if you’re feeling confident, you can dive even deeper with a POS integration for reporting.
Remember, taking the time to get comfortable with your reporting is an investment into your business long-term, so while reading reports may not be the most glamorous Saturday morning, it’s a day well spent.

Katie is a former Content Marketing Specialist at TouchBistro where she writes about food and restaurant experiences. She doesn’t shy away from the finer things in life, but no matter how much success she continues to acquire, she stays true to her roots and still considers imitation crab as gourmet. If she isn’t writing, you can find her on a patio with friends and a pitcher of white wine sangria.
Learn how to make the most of your restaurant reports
The right POS should help you increase sales
The right POS should help you increase sales.