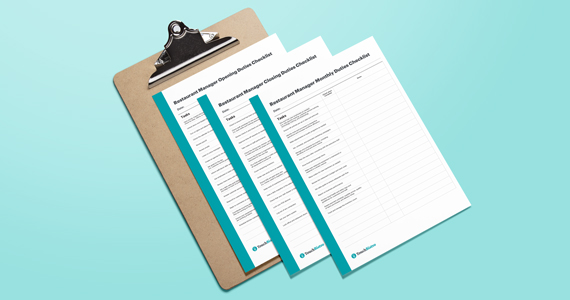
Use this free restaurant P&L template for Excel to track your restaurant's financial health.
Why Your Restaurant Needs a Profit and Loss Template
Whether you run a tiny cafe or a sprawling family-style joint, a restaurant profit and loss template is essential to ensure your finances are on track.
A profit and loss statement, often referred to as a P&L statement, is a financial document that details the revenues, costs, and expenses incurred by a business during a specified period (often a quarter or a fiscal year). In short, a P&L statement provides a snapshot of a business’ ability or inability to generate profit.
A restaurant profit and loss statement is one of many financial documents you need as a business owner to keep track of how you’re doing financially. While this is a crucial financial document, putting this information together can be a bit overwhelming if you’re a first-time restaurateur.
That’s where our free P&L template for restaurants comes in handy. Designed specifically for Excel and Numbers, this restaurant profit and loss statement template will help you take the first steps toward creating this key financial document.
What’s in a P&L Statement
Because filling out a P&L statement can be daunting, here’s an overview of all the different pieces you need to include.
- Sales – All the revenue earned during the period. You can break this down by type, such as food, liquor, beer, wine, merchandise, etc.
- Cost of goods sold (CoGS) – All the costs for preparing the food, drinks, and other merchandise you sold.
- Labor costs – How much you spent on employee salaries and benefits.
- Other variable expenses – These are irregular expenses you had during the period, such as repairs, entertainment, and marketing.
- Fixed expenses – These are recurring expenses, like rent and equipment leases.
- Depreciation and amortization – These are expenses for tangible and intangible assets that you spread out over their useful life because they lose value over time.
- Interest Expense – How much you’ve paid in interest on loans or other debt.
- Other (Income)/Expense – Any other income or expenses your business had that you haven’t already included in an earlier section.
How to Use a P&L Statement Template
When you first open the restaurant P&L template, some of the information may be familiar. A P&L statement is similar to a cash flow statement in that it details changes in accounts over a set period. This is also different than a balance sheet. In contrast, a balance sheet highlights what a business owns and owes at a single moment.
To start using your free P&L template for restaurants, follow these three steps:
1. Select a time frame
This is the period you’re trying to measure your profit and loss for. While most P&L statements are used quarterly or annually, you can also use them weekly or monthly. It’s a good idea for restaurants to generate a profit and loss statement regularly because unexpected operating costs or major fluctuations in sales are common occurrences that can easily throw your finances off track.
2. Input your sales (revenue) data
This part of your P&L is also known as the top line. From your revenue, you’ll subtract the costs of doing business (step 3).
3. Enter your different costs and expenses
These include the price of day-to-day operating costs, cost of goods sold, labor costs, and more. The difference between your revenue and your business costs is net income (the bottom line). This is also referred to as your profit or earnings.
How to Read a P&L Statement
After following the three steps to filling out your P&L statement, the template will automatically do the calculations for you so you can know the following key metrics.
Totals for all the sections you filled out (like total sales, total CoGS, total labor, etc.).
Prime Cost and Gross Margin
- Prime Cost – The total cost of ingredients, materials, and labor for creating your menu items and serving customers.
- Gross Margin – The difference when you subtract the prime cost from your total sales.
These two metrics help you see your restaurant’s profitability. If your prime cost is much higher than your gross margin, that tells you that you may need to reevaluate your pricing and/or your spending. Or, if your gross margin is higher than your prime cost, then you know your restaurant is running efficiently.
Controllable Costs and Controllable Income
- Total Controllable Costs – The sum of your prime cost and total other variable expenses (but not your fixed expenses).
- Controllable Income – The difference when you subtract your total other variable expenses (but not your fixed expenses) from your gross margin.
Controllable costs and controllable income are the expenses and revenue you can directly impact and change, which is why controllable costs doesn’t include your fixed expenses or other expenses like amortization and debt interest.
These numbers can tell you if you need to change how you’re operating to improve profitability and cut costs. For example, if your total controllable costs is higher than you want it to be, you might want to change certain suppliers or negotiate with vendors to save money.
EBITDA and Income Before Income Taxes
- EBITDA (Operating Income) – The difference when you subtract total fixed expenses from your controllable income.
- Income Before Income Taxes – The difference when you subtract the sum of your additional expenses (depreciation and amortization, interest, and other expenses) from your EBITDA (operating income).
EBITDA stands for Earnings Before Interest, Taxes, Depreciation, and Amortization. So, as the name suggests, EBITDA is your restaurant’s income excluding non-cash expenses, while your income before taxes includes non-operating expenses and income. Both metrics give you a look at how profitable your business is after accounting for various costs and expenses.
Business Insights from a P&L Statement
The data you provided in the template and the calculations will give you key financial points about your restaurant. By keeping an eye on these numbers, you can then make important financial decisions.
Here are some examples of the kinds of insights you can gain from using P&L statements.
- Sales Trends: By monitoring your sales data over time, you’ll know exactly when your sales numbers went up or down and can identify the reasons why – what happened during that period that would cause the change? With that knowledge, you can plan the appropriate next steps (whether that’s trying to maintain your increasing sales or investigating what changes to make to further improve sales).
- Cost of Goods Sold (COGS): If your look at your P&L statements over multiple periods and notice food costs are creeping up, it might be time to get rid of some low-margin menu items.
- Operating costs: Looking at the individual line items contributing to your total CoGS, labor, and other variable expenses can help you identify where you’re spending the most on business operations, and if there are areas you can cut back on or spend more on to help business growth.
- Industry benchmarks: You can compare your metrics to the restaurant industry’s benchmarks to see how well your business is performing or which areas you can improve in.
With all these business insights waiting to be learned, this restaurant P&L template is a must-have for any restaurateur.