Running a full service restaurant in the U.S. is no easy business.
But with the right knowledge and tools, it doesn’t have to seem like an impossible feat.
That’s why we collected insight from restaurateurs across the country – to better understand the current state of the restaurant industry and to pass that understanding on to you.
From financial health to reporting to online ordering, we asked over 500 restaurant owners, managers, and presidents/CEOs to share how they’re managing their operations.
Reading the full report will help you:
- Understand what’s happening in the restaurant industry
- See how your restaurant compares with national and statewide averages
- Discover consistent challenges for restaurants across the country
- Learn how restaurateurs are approaching those challenges and how you can overcome them
- Identify growth opportunities that will work for your full service restaurant
Here’s a brief look at what’s happening in full service restaurants in 2019 – the good, the bad, and the really, really hopeful.
Financial Health Check
Are Full Service Restaurants Staying Profitable in 2019?
While there are a ton of nuances to consider when looking at the profitability of a restaurant – how long it’s been open, what’s happening with import tariffs, when the next minimum wage hike is coming, etc. – profit margin is still the first place to look when you want to see how the business is doing.
For the U.S. restaurant industry, the financial news is good news.
Our restaurant industry analysis for 2019 revealed that full service restaurants (FSRs) in the U.S. have an average profit margin of 11% – that’s incredible!
While profit margins grow as restaurateurs get more experience in the industry, we found that margins actually max out at 11% after five years of experience – even as an FSR’s annual revenue continues to grow.
What does this mean for you?
Well, 11% may be the benchmark to aim for. As you optimize your operations and grow your business, you can set 11% as your target profit margin and use that number as a high-level measure of success.
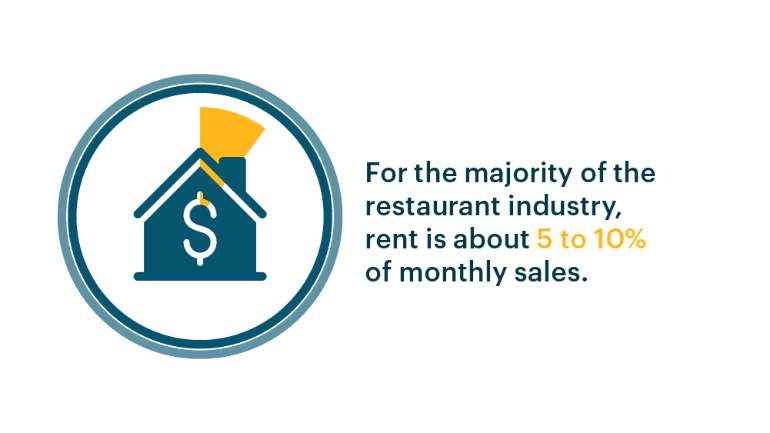
Because rent is such a large overhead expense for restaurants, it has a big impact on profitability – which is why we took a look at these costs as part of our report’s financial health check.
What we found: 84% of FSRs in the U.S. rent – rather than own – their space. And, for the majority of the restaurant industry, rent is about 5 to 10% of monthly sales.
While two-thirds of restaurateurs say they can handle a rent increase of more than 4%, this ultimately depends on the size of the restaurant.
Choosing and Using a POS
Making the Most of Technology
Your point of sale (POS) is the main hub of your restaurant operations, helping you track sales, forecast labor needs, manage inventory, and so much more.
When it comes to choosing the right POS, our report found that restaurateurs use three factors to decide:
- Affordability
- Ease of use
- System reliability
For processing transactions, we found that cash, credit, and debit payments are almost universal across FSRs in the U.S. However, restaurants are increasingly accepting mobile payment options like Apple Pay, Google Pay, and Samsung Pay, with 18% set up to accept all three.”
It’s important to work with a payment processor that lets you offer this range of payment options. However, our restaurant industry analysis for 2019 also revealed that four in five restaurateurs are frustrated with their payment processors, citing lack of pricing transparency and POS integration as their top complaints.
Sound familiar?
Side note: Your POS should provide options for payment processing, so you can choose the solution that works best for your venue. To get more information, visit our Ultimate Guide to Payment Processing for Restaurants.
Restaurant Data & Reporting
(Shake) What Your Data Gave You
Choosing a POS for your business is important. How you use the system may be even more so.
Ideally, that means using the data your POS provides to make better business decisions.
However, we found that almost 30% of restaurateurs don’t have a full understanding of what their POS data is telling them and can’t use these insights to drive their business decisions.
That means they’re missing out on tools that are right at their fingertips, which could help them solve some of the challenges they’re facing in the restaurant industry.
Inventory Management
What’s in Stock
Our research found that restaurateurs use both spreadsheets and their POS to take inventory and manage food costs. Most are doing this on a weekly basis (if not more frequently).
However, 58% of restaurateurs struggle to manage inventory and that most often ends with ordering too much food.
Predictive analytics and forecasting can help with preparing inventory orders, but more than a third of restaurants surveyed aren’t using these tools.
Staffing
Dealing with Scheduling and Labor Shortages
Our restaurant industry analysis showed that only half of restaurateurs are using POS reports to make decisions about employee scheduling.
That’s a big problem.
Why?
Seven in 10 restaurants experience labor shortages regularly, which means restaurants would really benefit from using this data to create more efficient schedules with the staff they do have.
Online Ordering
Growth Opportunities for Full Service Restaurants
Though online ordering – or third-party online ordering systems – are still fairly new, our report shows that restaurants are jumping on board and finding huge success with this trend.
Almost four in five FSRs use an online ordering platform and the majority are using two or more different platforms.
Restaurants that have implemented online ordering have seen an impressive 11 to 20% increase in sales.
No two restaurants are completely the same. Different cities, different food, different people – these all add up to unique restaurant DNA.
But our restaurant industry report reveals that many restaurateurs are dealing with similar challenges and finding success with similar strategies. These present perfect opportunities to learn from the experiences of fellow restaurateurs so the industry as a whole can continue growing, in 2019 and beyond.
This study was conducted by Maru Matchbox research firm on behalf of TouchBistro.
The results come from surveying over 500 full service restaurant owners, managers, and presidents/CEOs from all 50 U.S. states. Included in this number was an increased focus on six major cities: New York City, Chicago, Los Angeles, Miami, Austin, and San Antonio. The research was conducted in December 2018.

Dana is the former Content Marketing Manager at TouchBistro, sharing tips for and stories of restaurateurs turning their passion into success. She loves homemade hot sauce, deep fried pickles and finding excuses to consume real maple syrup.
Download our free inventory template
Get our restaurateur newsletter: The Bistro Insider

Your Complete Guide to Restaurant Reservations
Download Guide